Where did my AWS CDK deployment time go?
I wanted to understand where my AWS CDK deployments spent their time without jumping between pipeline actions, build logs, and CloudFormation events. So I built Pipeline Profiler: a free, MIT-licensed local tool that brings that evidence together in one HTML report.
The interesting problem was producing a useful explanation from incomplete evidence without presenting guesses as measurements.
Open the interactive example. All published examples are fictional, including their names, architecture, logs, and timings.
From a pipeline action to a CDK construct
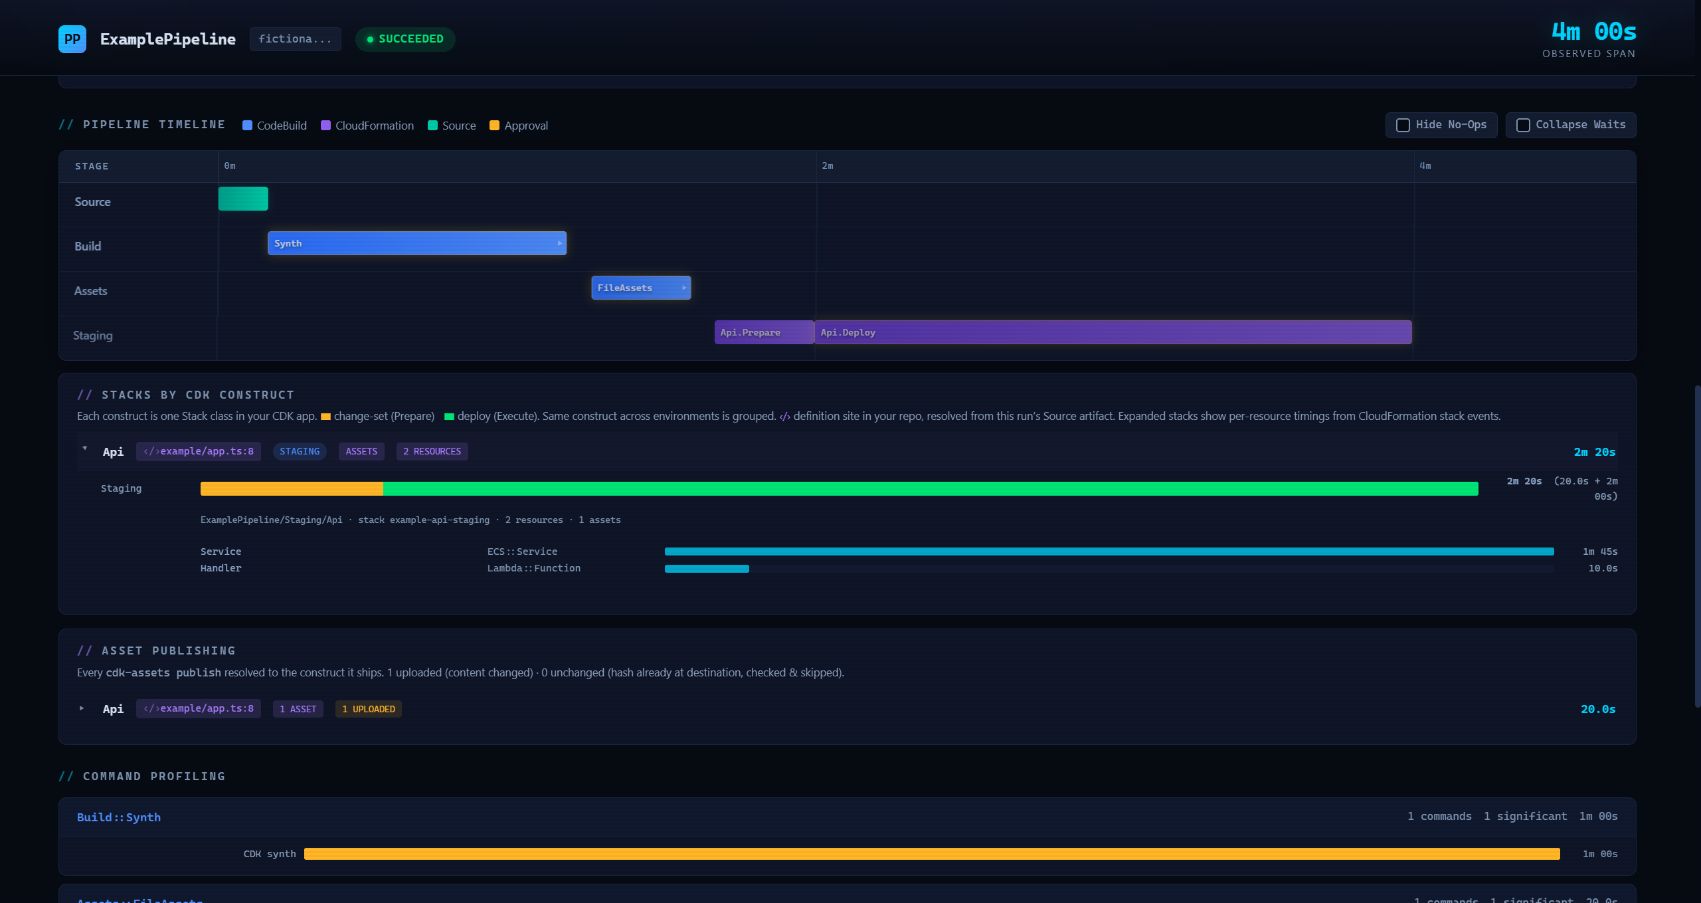
I wanted to follow a slow deployment down to the resource and CDK construct involved. In the standard example, expand the CDK details to see a CloudFormation action connected to its stack and resource timings. The asset details also identify the consuming construct, giving an otherwise opaque hash some context.
Those connections come from joining action metadata, build logs, assembly manifests, synthesized templates, and stack events. Missing permissions, expired artifacts, or incomplete logs can leave gaps in the report.
My earlier CloudFormation Profiler focuses on stack events. This tool puts them in the context of the wider pipeline execution.
The trap: adding durations
Consider the approval example. Its observed execution span is 800 seconds. An approval action lasts 600 seconds, but a smoke test runs during its first 60 seconds.
Counting those 60 seconds as both work and approval-only waiting would count the same time twice. The report instead separates the observed span into:
- 250 seconds covered by non-approval actions;
- 540 seconds covered only by approval;
- 10 seconds not attributed to an action.
The categories add up to 800 seconds. The 60 seconds of approval overlap are recorded separately.
Action coverage includes queueing and provisioning; it is not a measure of CPU activity. Whether shortening an approval speeds up a release depends on its dependencies and release policy.
The observed span starts at the first available action, excluding any earlier pipeline-level queue.
A difference is a lead, not a diagnosis
The same example includes a package action taking 120 seconds, compared with 55–65 seconds in six prior executions. That difference is an investigation lead: workloads and configurations may have changed even when the action name stayed the same.
I use successful final attempts for the historical baseline so retries aren’t counted as independent runs. The report compares against the median and withholds p95 when fewer than 20 samples are available.
When CDK runs inside a build step
The direct-CDK example identifies CDK commands inside a CodeBuild shell block and shows a failed build phase with the relevant log excerpt.
Resource-level enrichment currently requires supported CloudFormation prepare/deploy action pairs; detecting cdk deploy inside a build provides command-level evidence instead.
Try it locally
With Node.js 22 or newer and npm installed:
git clone https://github.com/bukov-ka/aws-pipeline-profiler.git
cd aws-pipeline-profiler
npm ci
npm run build
node dist/index.js --demo standard --output demo.html
Open demo.html in a browser. The demo runs offline without AWS credentials. You can also use --demo approval or --demo direct.
Collection is read-only: the tool needs no permission to start, stop, approve, or modify deployments. For a real execution, follow the repository’s permissions and usage instructions.
Keep real reports private until reviewed. The default pattern redaction is not full anonymization: internal names, architecture, source snippets, and arbitrary log content can remain.
If this looks useful, try the tool or inspect the code. I’d welcome bug reports with small synthetic reproductions.